I have been working on deploying and setting up a new monitoring stack
for Crans network organisation.
We switched from Munin and
Icinga2 to
Prometheus paired with
Grafana dashboards.
Using Prometheus SNMP exporter, this new monitoring stack can collect metrics from all of our
Unifi WiFi access point.
This article describes a minimal setup that display Unifi
metrics onto a Grafana Worldmap panel.
What components will be used#
The Unifi controller has an interface to place Unifi hardware on a worldmap.
Using these positions, we are going to provision these coordinates on each device
then collect it back with Prometheus SNMP exporter.
This was done with Unifi access points but it should be easy to adapt to
other hardware manufacturers and devices.
Enable SNMPv3 on managed devices#
Prometheus will collect access points metrics with SNMPv3
so make sure it is enabled in the controller settings:
Settings > Services > SNMP then enable SNMPv3 and set a username
and password.
These login credentials will be needed later in Prometheus SNMP exporter
configuration.
Set the location of access points#
You need to make sure all the access points are placed on the Unifi
Controller Google Map.
We will export those latitudes and longitudes in the next section.
Convert Unifi Controller locations to SNMP locations#
The Unifi Controller doesn’t provision devices with their respective location
given on the controller map.
Nevertheless, the controller enables users to fill SNMP sysLocation and
provision that data. So let’s write a short Python 3.5+ script to copy that
data over.
It comes with a hitch. SNMP sysLocation field holds a single string of
text and we don’t want to split the latitude and longitude later in Grafana.
So we are going to also convert locations into geohashs that Grafana Worldmap
panel supports.
Please be careful before running the following script and make sure you have
a backup of your controller data.
 1
 2
 3
 4
 5
 6
 7
 8
 9
10
11
12
13
14
15
16
17
18
19
20
21
22
23
24
25
26
27
28
29
30
31
32
33
34
35
36
37
38
39
40
41
42
43
44
45
46
47
48
49
50
51
52
53
54
55
56
57
58
59
60
61
62
63
64
65
66
67
68
69
70
71
72
| """
This script edits Unifi Controller MongoDB database
to read each device location
and copy it over SNMP "sysLocation" (1.3.6.1.2.1.1.6).
This enables Prometheus to collect device locations.
Require PyMongo.
"""
from pymongo import MongoClient
def geohash(latitude, longitude, precision=12):
"""
Encode a position given in float arguments latitude, longitude to
a geohash which will have the character count precision.
From Geohash pipy package under GPL license, Leonard Norrgard
"""
__base32 = '0123456789bcdefghjkmnpqrstuvwxyz'
lat_interval, lon_interval = (-90.0, 90.0), (-180.0, 180.0)
geohash = []
bits = [16, 8, 4, 2, 1]
bit = 0
ch = 0
even = True
while len(geohash) < precision:
if even:
mid = (lon_interval[0] + lon_interval[1]) / 2
if longitude > mid:
ch |= bits[bit]
lon_interval = (mid, lon_interval[1])
else:
lon_interval = (lon_interval[0], mid)
else:
mid = (lat_interval[0] + lat_interval[1]) / 2
if latitude > mid:
ch |= bits[bit]
lat_interval = (mid, lat_interval[1])
else:
lat_interval = (lat_interval[0], mid)
even = not even
if bit < 4:
bit += 1
else:
geohash += __base32[ch]
bit = 0
ch = 0
return ''.join(geohash)
collection = MongoClient("mongodb://localhost:27117").ace.device
for device in collection.find():
# Get device location
x, y = device.get('x'), device.get('y')
if not (x and y):
print("Oh crap, one device hasn't been placed yet")
else:
# Compute geohash and replace
snmp_location = geohash(x, y)
if snmp_location != device.get('snmp_location'):
print("{} ({}) updated with geohash {}, was {}".format(
device['name'],
device['_id'],
snmp_location,
device['snmp_location'],
))
collection.update_one(
{'_id': device['_id']},
{'$set': {'snmp_location': snmp_location}},
)
|
Now after a controller restart you will be able to reprovision all access points.
To do so please follow official instructions.
Warning! Restarting the controller or provisioning new data will make your access points unavailable during ~20-40s!
Now all devices should return their respective geohash when collecting “sysLocation” (1.3.6.1.2.1.1.6) through SNMPv3.
If it hasn’t been done yet, install Prometheus SNMP exporter.
On a Debian-based system, you can apt install prometheus-snmp-exporter.
As it is a service, you might need to activate it and restart it after each
configuration change.
Now make sure /etc/prometheus/snmp.yml is chmoded 0600
and owned by prometheus (or the user used to launch the service).
This will protect the SNMPv3 credentials inside.
Then put inside the following:
 1
 2
 3
 4
 5
 6
 7
 8
 9
10
11
12
13
14
15
16
17
18
19
20
21
22
23
24
25
26
27
28
29
30
31
32
33
34
35
36
37
38
39
40
41
42
43
44
45
46
47
48
49
50
51
52
53
54
55
56
57
58
59
60
61
62
63
64
65
66
67
68
69
70
71
72
73
74
75
76
77
78
79
80
81
82
| ubiquiti_unifi:
walk:
- 1.3.6.1.4.1.41112.1.6
get:
- 1.3.6.1.2.1.1.5.0
- 1.3.6.1.2.1.1.6.0
metrics:
- name: unifi_sys_location
oid: 1.3.6.1.2.1.1.6
type: DisplayString
help: The physical location of this node as a geohash
- 1.3.6.1.2.1.1.6
- name: unifi_vap_channel
oid: 1.3.6.1.4.1.41112.1.6.1.2.1.4
type: gauge
help: ' - 1.3.6.1.4.1.41112.1.6.1.2.1.4'
indexes:
- labelname: unifi_vap_index
type: gauge
lookups:
- labels: [unifi_vap_index]
labelname: unifi_vap_essid
oid: 1.3.6.1.4.1.41112.1.6.1.2.1.6
type: DisplayString
- labels: [unifi_vap_index]
labelname: unifi_vap_radio
oid: 1.3.6.1.4.1.41112.1.6.1.2.1.9
type: DisplayString
- labels: []
labelname: unifi_vap_index
- name: unifi_vap_num_stations
oid: 1.3.6.1.4.1.41112.1.6.1.2.1.8
type: gauge
help: ' - 1.3.6.1.4.1.41112.1.6.1.2.1.8'
indexes:
- labelname: unifi_vap_index
type: gauge
lookups:
- labels: [unifi_vap_index]
labelname: unifi_vap_essid
oid: 1.3.6.1.4.1.41112.1.6.1.2.1.6
type: DisplayString
- labels: [unifi_vap_index]
labelname: unifi_vap_radio
oid: 1.3.6.1.4.1.41112.1.6.1.2.1.9
type: DisplayString
- labels: []
labelname: unifi_vap_index
- name: unifi_vap_tx_power
oid: 1.3.6.1.4.1.41112.1.6.1.2.1.21
type: gauge
help: ' - 1.3.6.1.4.1.41112.1.6.1.2.1.21'
indexes:
- labelname: unifi_vap_index
type: gauge
lookups:
- labels: [unifi_vap_index]
labelname: unifi_vap_essid
oid: 1.3.6.1.4.1.41112.1.6.1.2.1.6
type: DisplayString
- labels: [unifi_vap_index]
labelname: unifi_vap_radio
oid: 1.3.6.1.4.1.41112.1.6.1.2.1.9
type: DisplayString
- labels: []
labelname: unifi_vap_index
- name: unifi_ap_system_model
oid: 1.3.6.1.4.1.41112.1.6.3.3
type: DisplayString
help: ' - 1.3.6.1.4.1.41112.1.6.3.3'
- name: unifi_ap_system_uptime
oid: 1.3.6.1.4.1.41112.1.6.3.5
type: counter
help: ' - 1.3.6.1.4.1.41112.1.6.3.5'
version: 3
auth:
security_level: authPriv
username: YOUR_SNMP_UNIFI_USERNAME
password: YOUR_SNMP_UNIFI_PASSWORD
auth_protocol: SHA
priv_protocol: AES
priv_password: YOUR_SNMP_UNIFI_PASSWORD
|
Don’t forget to change YOUR_SNMP_UNIFI_USERNAME and YOUR_SNMP_UNIFI_PASSWORD
with your SNMPv3 credentials filled in
step 1.
You might want to use Prometheus SNMP exporter generator to generate that file
but you might need to do manual tuning to keep the metrics indexed on the
SSID and radio.
Now let’s test that everything is working,
you should obtain something similar to:
1
2
3
4
5
6
7
| erdnaxe ~ % curl "127.0.0.1:9116/snmp?module=ubiquiti_unifi&target=IP_ACCESS_POINT" | grep "unifi_sys_location"
% Total % Received % Xferd Average Speed Time Time Time Current
Dload Upload Total Spent Left Speed
100 9028 100 9028 0 0 30500 0 --:--:-- --:--:-- --:--:-- 30397
# HELP unifi_sys_location The physical location of this node as a geohash - 1.3.6.1.2.1.1.6
# TYPE unifi_sys_location gauge
unifi_sys_location{unifi_sys_location="SOME GEOHASH"} 1
|
If everything is working you are almost finished!
Edit your Prometheus configuration /etc/prometheus/prometheus.yml to scrape
your SNMP exporter.
 1
 2
 3
 4
 5
 6
 7
 8
 9
10
11
12
13
14
15
16
17
18
19
20
21
22
| scrape_configs:
# The .json in file_sd_configs is dynamically reloaded
- job_name: prometheus
static_configs:
- targets:
- localhost:9090
- job_name: unifi_snmp
file_sd_configs:
- files:
- '/etc/prometheus/targets_unifi_snmp.json'
metrics_path: /snmp
params:
module: [ubiquiti_unifi]
relabel_configs:
- source_labels: [__address__]
target_label: __param_target
- source_labels: [__param_target]
target_label: instance
- target_label: __address__
replacement: 127.0.0.1:9116
|
This configuration makes Prometheus dynamically reload
/etc/prometheus/targets_unifi_snmp.json.
You just have to list your Unifi devices in this file:
1
2
3
4
5
6
7
8
9
| [
{
"targets": [
"a first access point ip",
[...]
"a last access point ip"
]
}
]
|
Now restart Prometheus and it should start to collect metrics from all
your access points.
Grafana examples#
Install Grafana Worldmap plugin and then go create some panel in a dashboard.
These are some examples:
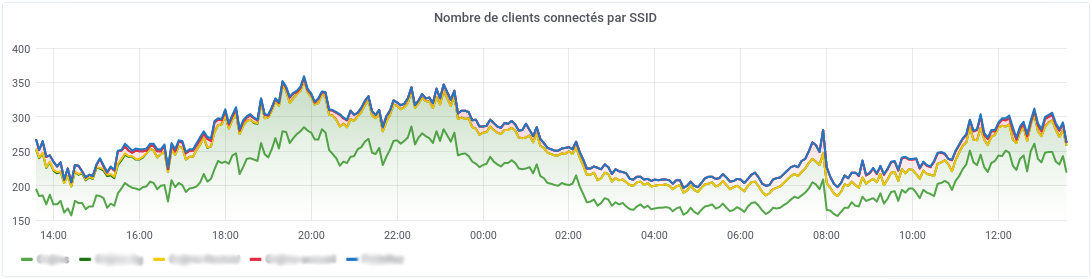
- Graph panel with
sum(unifi_vap_num_stations) by (unifi_vap_essid)
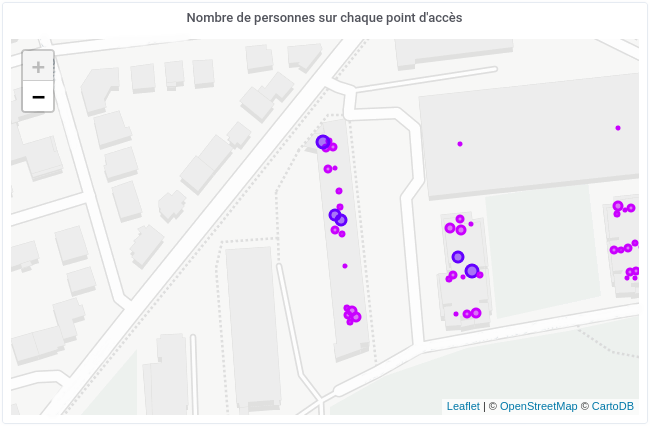
to plot client per SSID on all access points, - Worldmap panel with
(sum(unifi_vap_num_stations) by (instance)) + on(instance) group_left(unifi_sys_location) (unifi_sys_location*0)
to graph number of clients on each access point, - Worldmap panel with
(max(unifi_vap_tx_power{unifi_vap_essid="Cr@ns"}) by (instance)) + on(instance) group_left(unifi_sys_location) (unifi_sys_location*0)
to graph emission power on each access point.